October 14, 2016 in Medford
The charts below show measured sound levels at a home on Stearns Ave in Medford, MA on October 14, 2016. The sound levels are annotated with the flight numbers of aircraft passing overhead at the time.
The charts are interactive. Mouse over a flight number to see the time, aircraft type, approximate noise level and altitude. Zoom and pan for more detail.
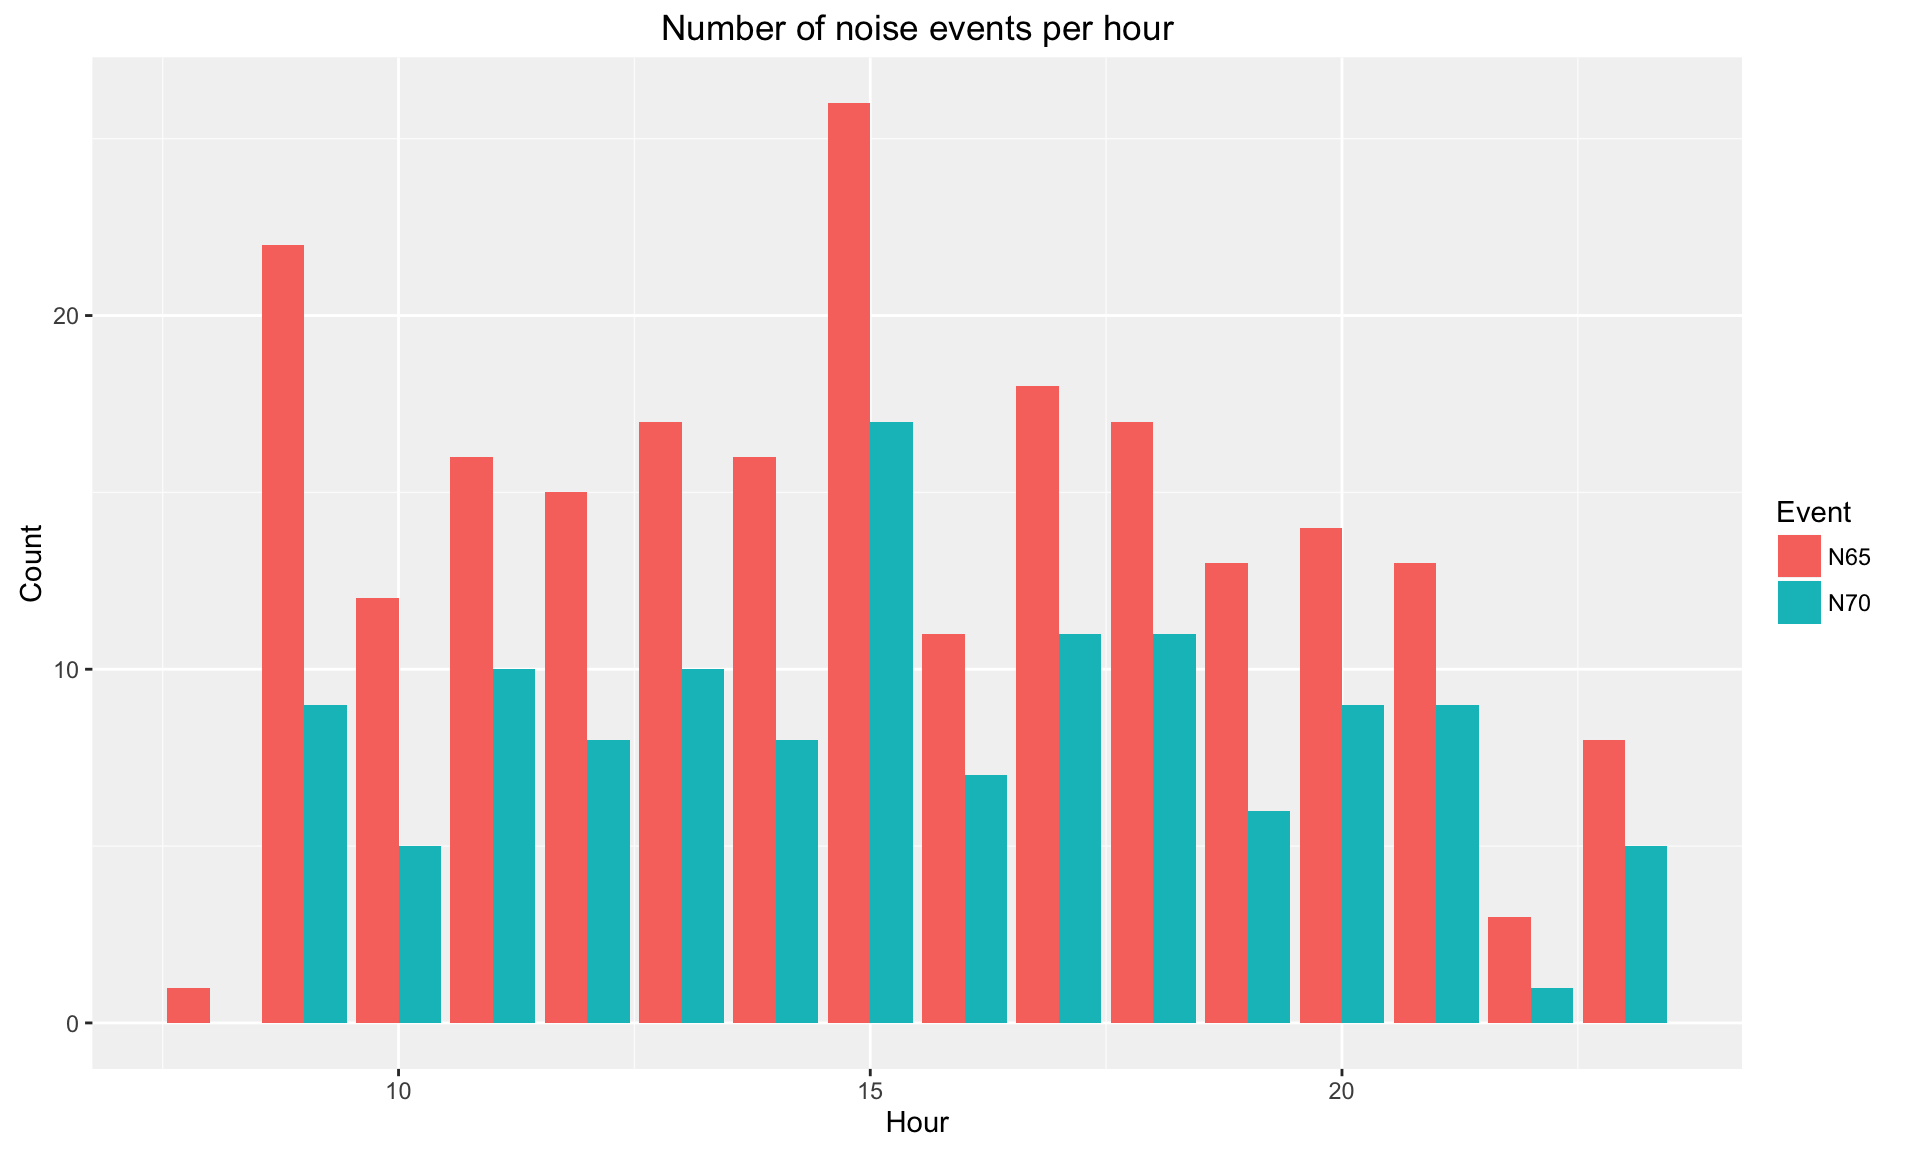
The four charts cover 15 hours from 9 am to midnight. During this period there were 400 flights near the house. The average time between flights during this period is 2 1/4 minutes. The median time between flights is only 90 seconds. 123 events greater than 70 dBA and 222 events greater than 65 dBA were measured, an average of one N70 event every seven minutes and one N65 event every four minutes.
Noise events
This chart shows the number of events with peak noise levels greater than 70 and 65 dBA (N70 and N65) in each hour.
Noise vs Altitude
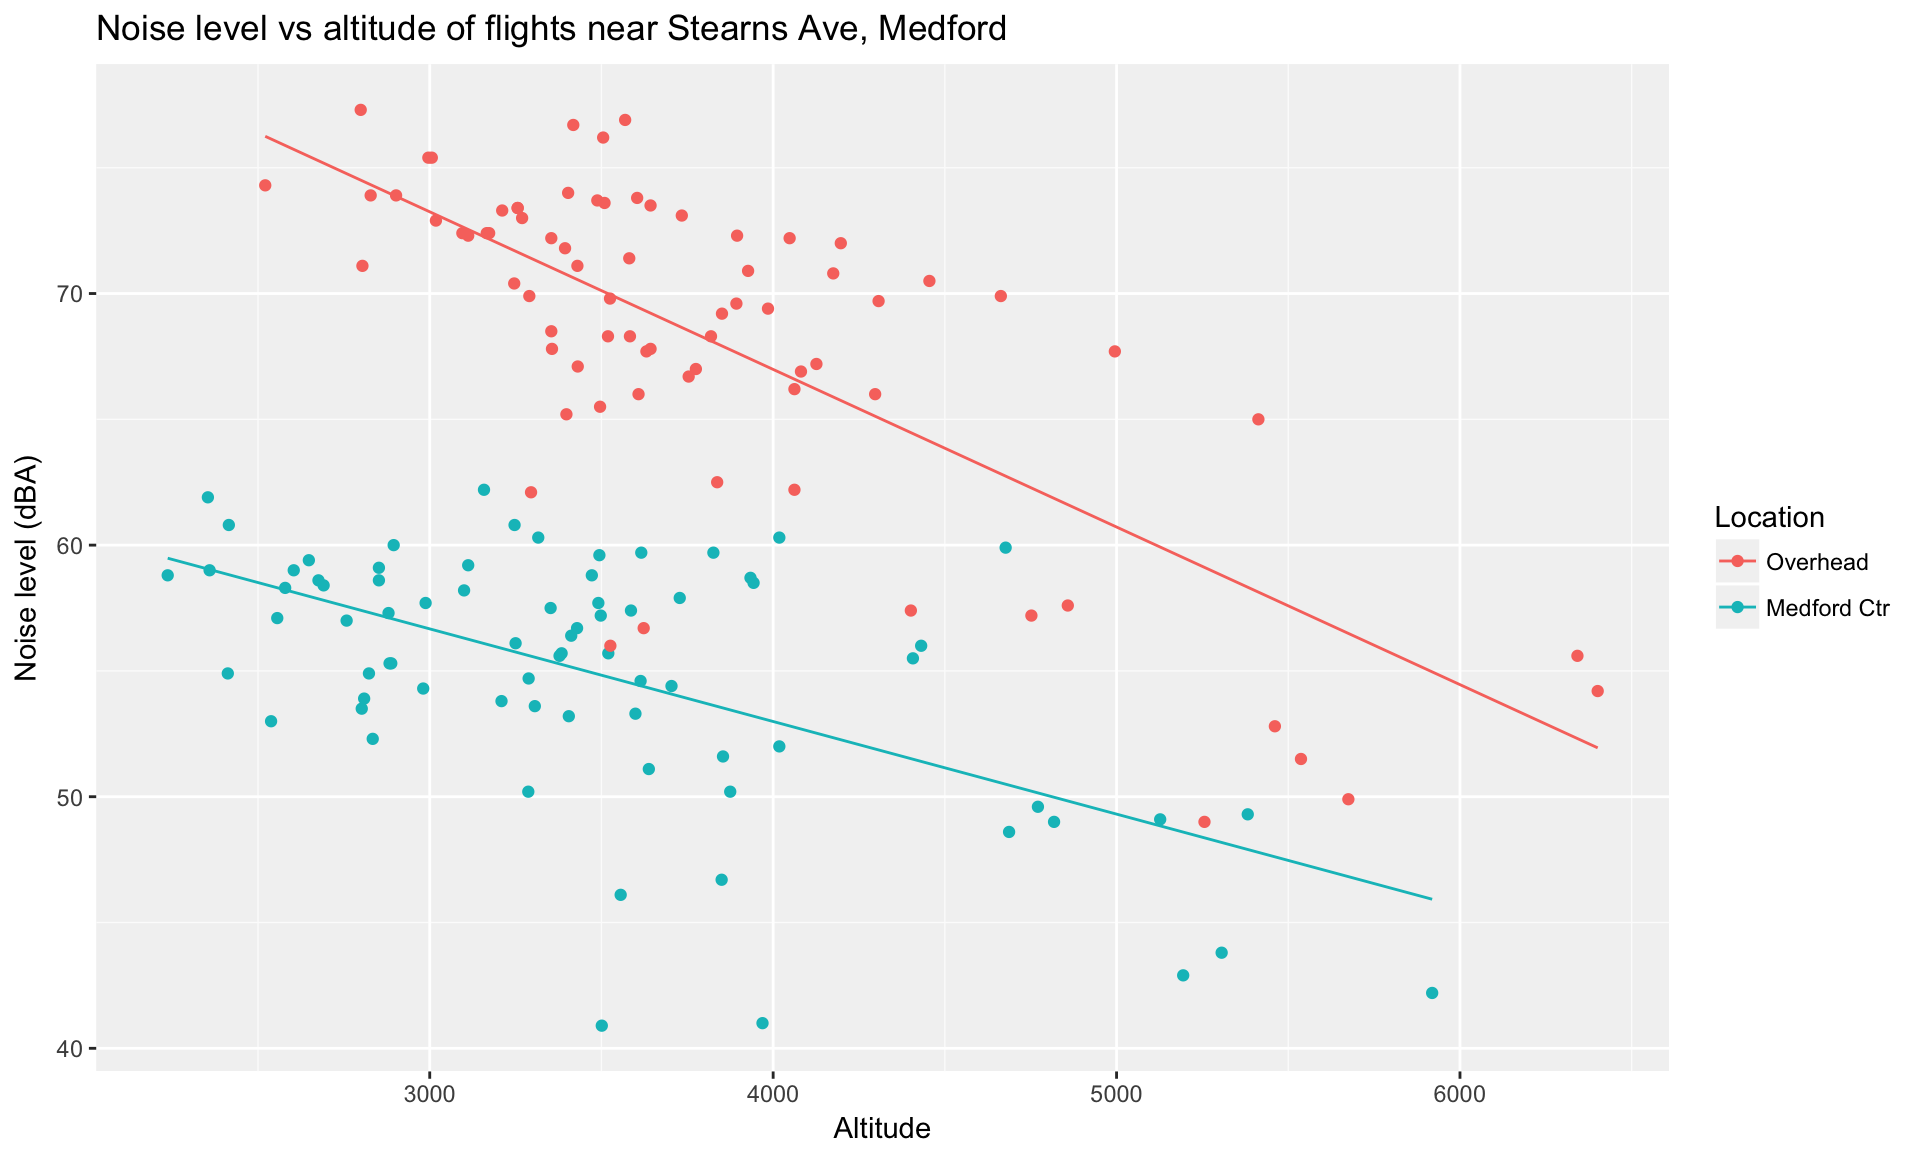
Of the identified flights, 76 flights went directly over the Stearns Ave home and 75 flights flew over Medford Center. The chart below shows the relationship of altitude (from Symphony) with the measured noise levels for the 151 flights passing over these two locations. For both locations there is a clear tendency for higher flights to be less noisy. For the overhead flights, there is a drop of about 6 dBA for every 1000 feet in altitude.
Flight tracks
These videos show the location where the measurements were taken and the actual flight tracks for two periods on October 14.
Video 1: 8:52am - 12:21 pm
Video 2: 4:38pm - 7:59pm
Sources
- Sound levels were measured with a NIST-certified Reed SD-4023 sound meter set to A-weighting, automatic range selection, slow response, and 1-second sample intervals. The calibration of the instrument was checked before collection with a Reed SC-05 Sound Level Calibrator.
- Flight numbers and times are from Massport’s Symphony PublicVue flight tracker.
- Flight tracks are recorded from ADS-B signals.
- Sound level measurements, flight data collection and flight video by Boston West Fair Skies volunteers.
- Noise level analysis and visualization by Kent S Johnson
Copyright 2016 Kent S Johnson  2016-11-25